
Did you know there are over 170 different community indicators on Skagit County Trends - each updated throughout the year? But which ones, and when?
This issue of the Skagit County Trends blog lists some of the most recently updated indicators on the Skagit County Trends website.
This page will be updated and email alerts sent on a quarterly basis. Don't miss an update - subscribe today!
Recent Updates
In PEOPLE:
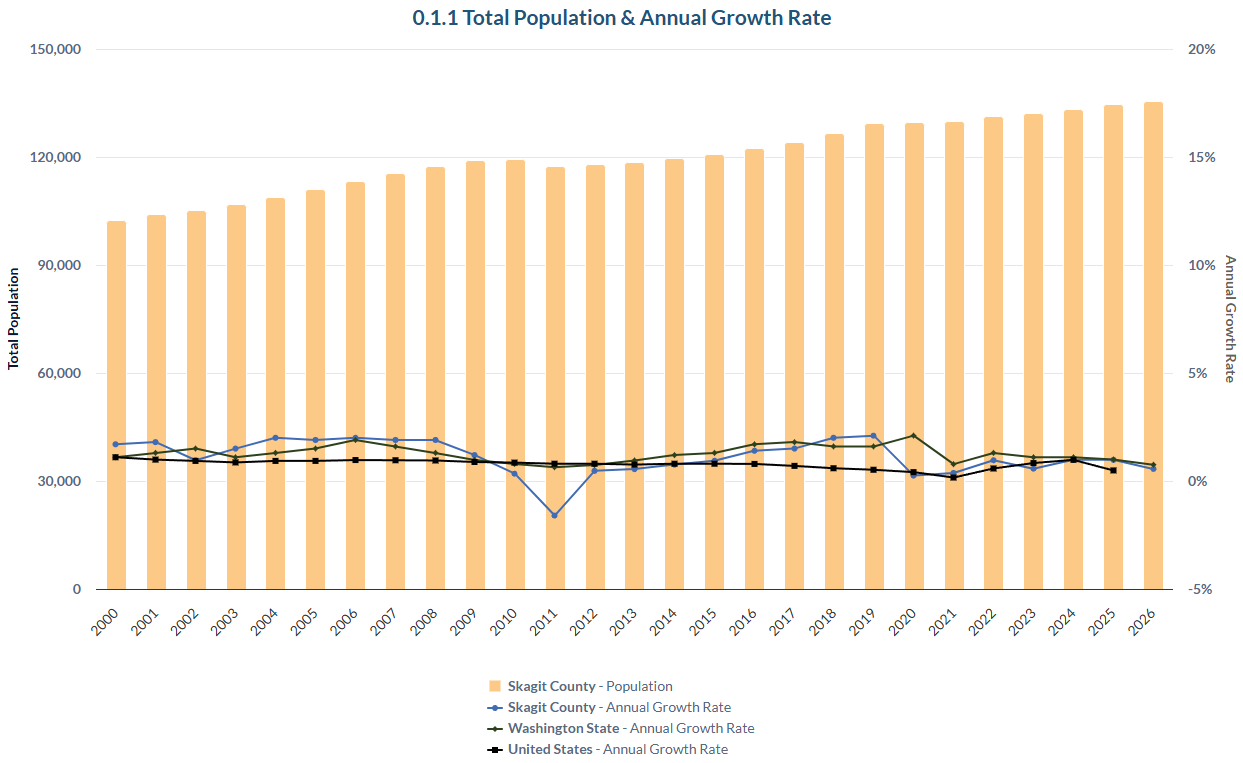
County population growth slowed over 2025.
The past year did not bring accelerated population growth to Skagit County. The estimated number of new residents rose to 135,350 by April of this year. That translates in a mere 0.6% increase over the prior April, representing about half of the annual compounded rate in the decade prior. Population growth here has trailed the rate for Washington state since the start of the pandemic, unlike in many prior years. 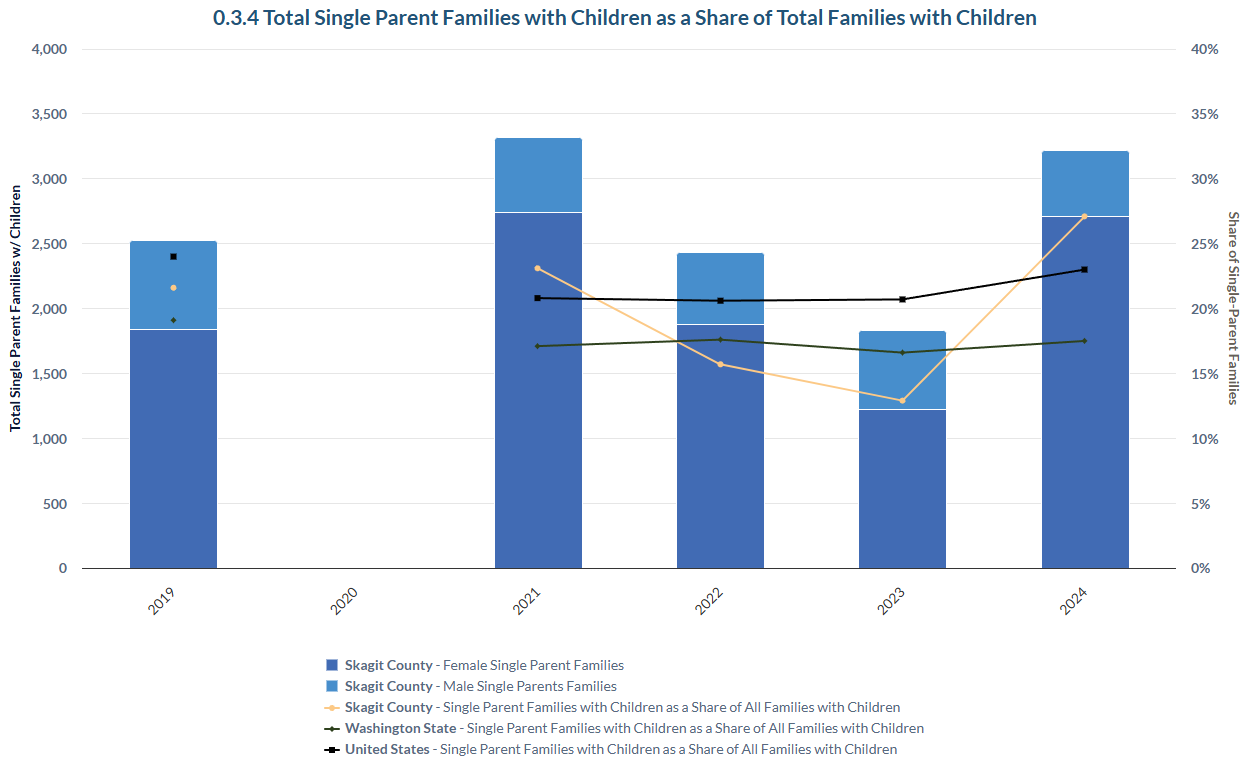 The number of single-parent families in Skagit County has recently grown.
After declining for two years, the number of single-parent families in the county rose substantially in 2024, Census estimated. Over 3,200 characterized the population that year, a bit fewer than the peak in 2021 and far more than in 2023. As consequence, the rate of this family type among all county families with children jumped, to 27%. It is now higher the shares for both the U.S. and the state.
2025 estimates will be released by Census at the end of September.
In AGRICULTURE: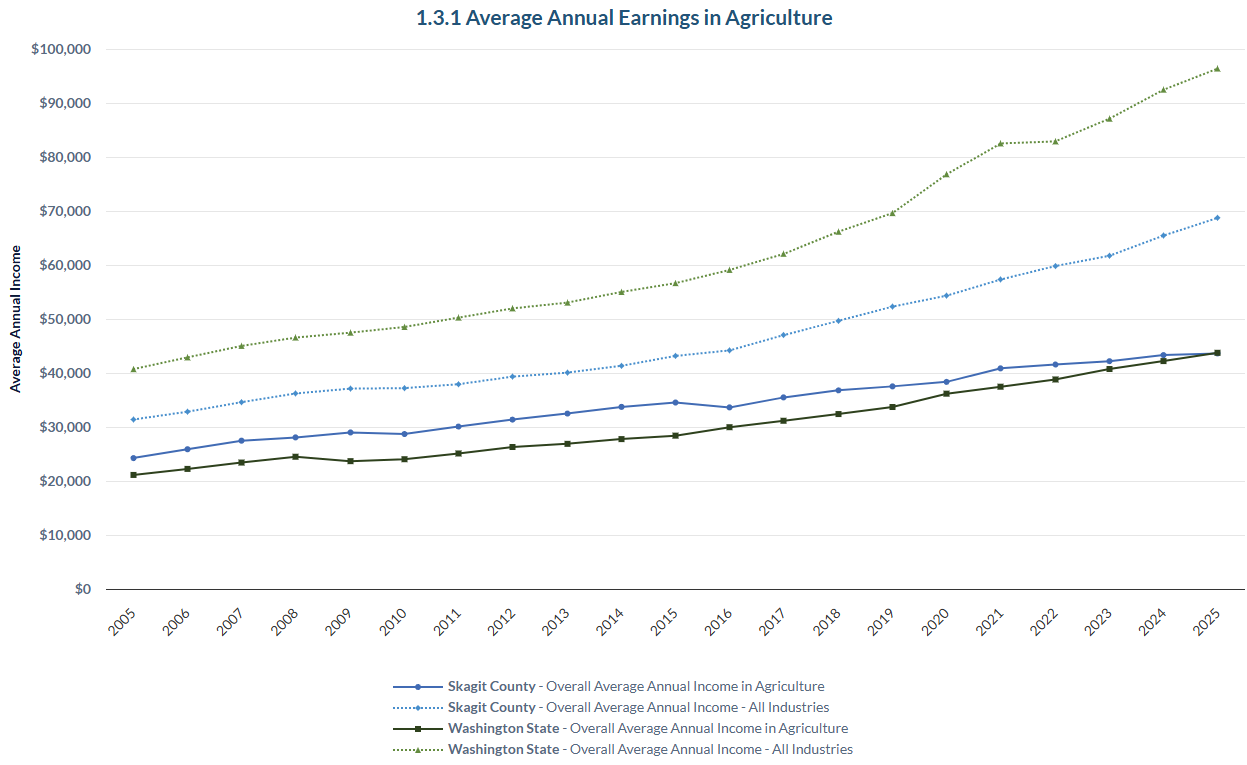 Average annual earnings in the agricultural sector rose in 2025 but are still quite low.
Agriculture is a key sector of the Skagit County economy, ranking 7th by headcount. Consequently, worker earnings will have an impact on other sectors, such as retail, accommodation/food services, and local government. Earnings will also largely determine incomes of agricultural workers. And earnings represent a significant component of costs for producers.
As is well known, agriculture pay is low - here and elsewhere - compared to compensation in other sectors. The 2025 county results, recently released, show average annual earnings in the sector to be about $43,600. This represents a jump of about $1,300 over the prior year. But the result puts annual pay of the county’s agricultural workers at about $25,000 less than the overall county average.
In ECONOMIC VITALITY: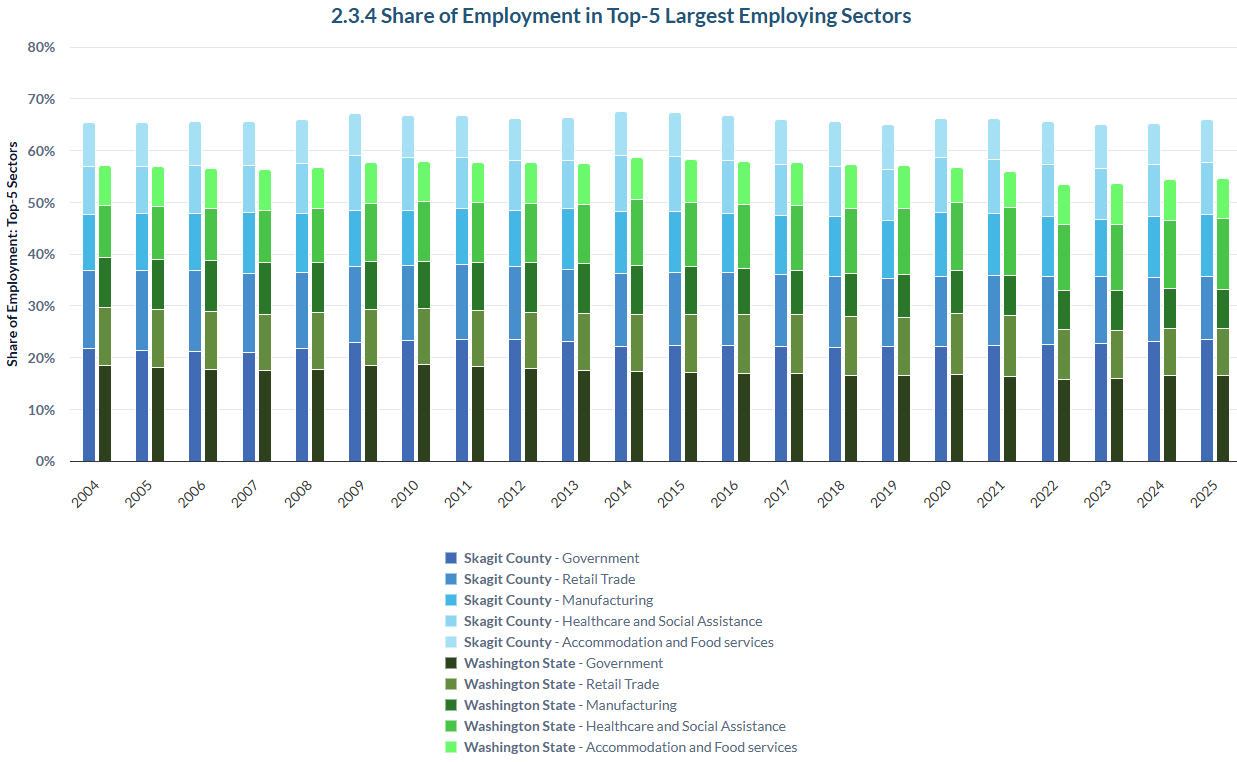
Share of employment in the 5 largest sectors by headcount
By examining the distribution of workers across the sectors, one can gain valuable insight into the structure of the local economy. In a smallish economy such as Skagit County, typically the five largest sectors claim two thirds or more of all workers. The mix of sectors and the size of the shares impact the overall level of wages paid to workers in a county.
In Skagit County, the five largest sectors are, in order: Government, retail trade, manufacturing, healthcare & social assistance, and hospitality. Sectors here that are proportionally larger than throughout the state are government (including public schools), retail trade, manufacturing, and to a lesser degree hospitality. The sector with the largest positive gap to the state average is manufacturing. In 2025, it claimed 12% of the county workforce, far above the state average of 7.5%. The one large sector with a negative gap was healthcare & social assistance. Its share of 10.1% was considerably lower than the state average of 13.6%. 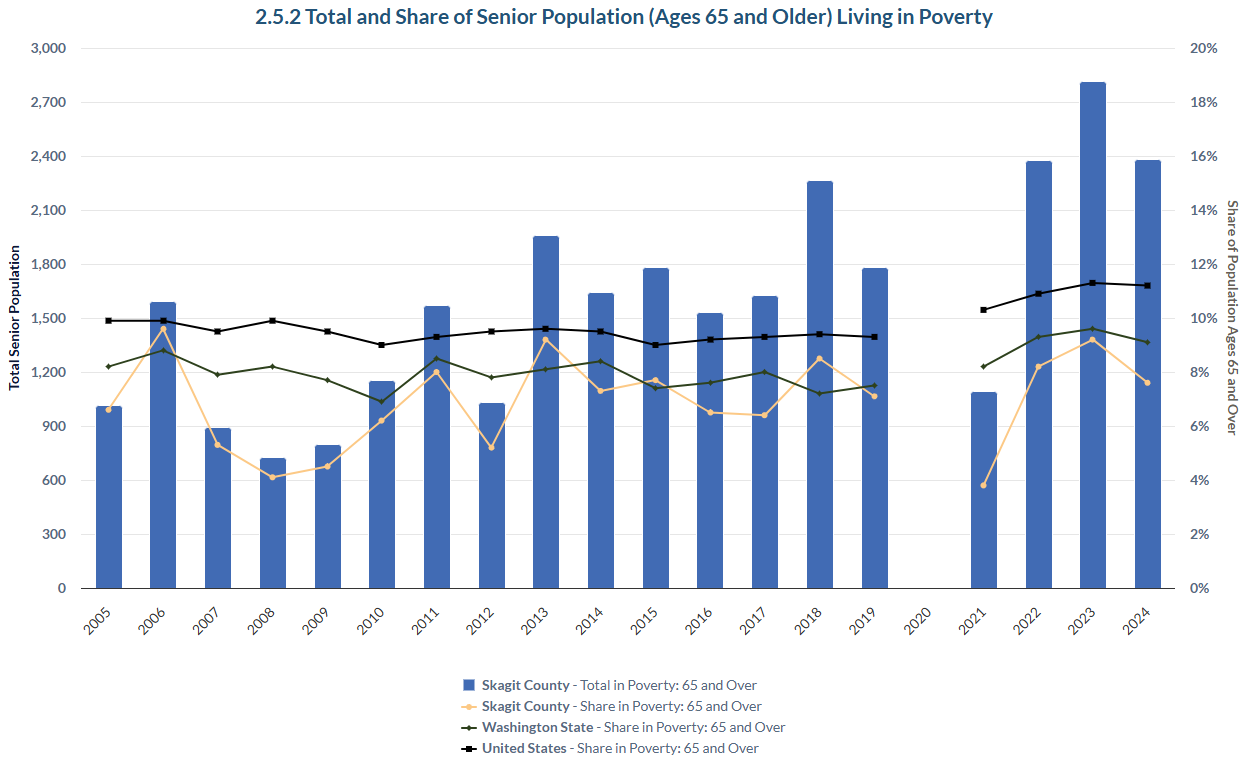
Poverty among Skagit County seniors has risen but the rate is still lower than the U.S. and the state.
The prospect of older adults living out the remainder of their lives in material want was a central motivation for the birth of the country’s social welfare systems. A key measure of this want is the poverty rate for the population 65 years and over. Federal poverty guidelines vary by family size and increase by the CPI; they do not change by geography.
After a reduction in 2021 from pre-pandemic year, the number of older adults in Skagit County living at or below the poverty threshold has hit record highs since then. In 2024, Census estimates put the number in the county at nearly 2,400, its second highest year on record. The rate, however, of seniors in poverty, at 7.6% in 2024, remains well below the rates of the U.S. and the state.
In EDUCATION: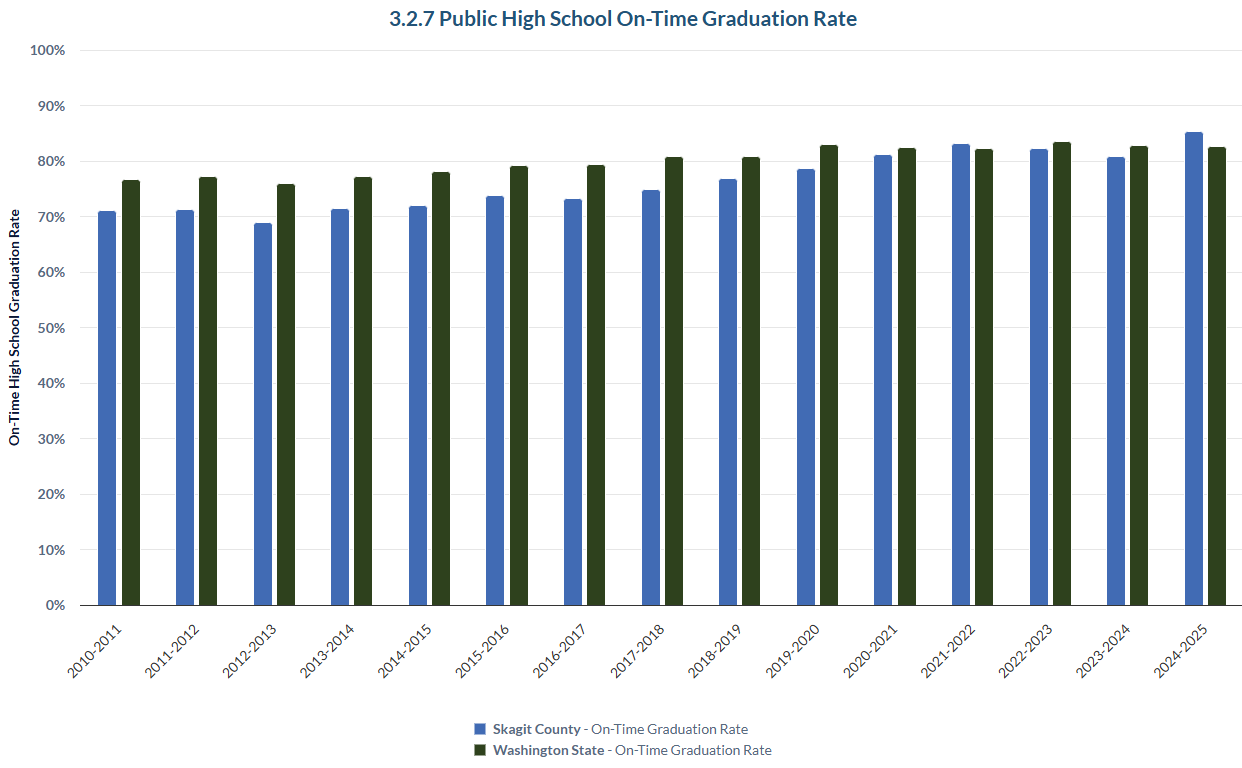 Public high school, on-time graduation rates hit an all-time high in 2025.
Crossing the stage to receive a diploma is one of the rites of passage for most teenagers. Ideally, for all teenagers, but that typically isn’t the case. For many reasons, we would like to see as many as possible reach this key milestone in one’s life. The on-time graduation rate is calculated as the total of those receiving a diploma after four years of school, divided by the size of 9th grade cohort, while adjusting for transfers.
In the spring of 2025, the Skagit County average rate of all school districts reached an all-time high of 85%. That represents a marked improvement from the class of 2016, which yielded a 74% graduation rate. For the first time since the measure was adopted statewide, Skagit County schools outperformed the state average. 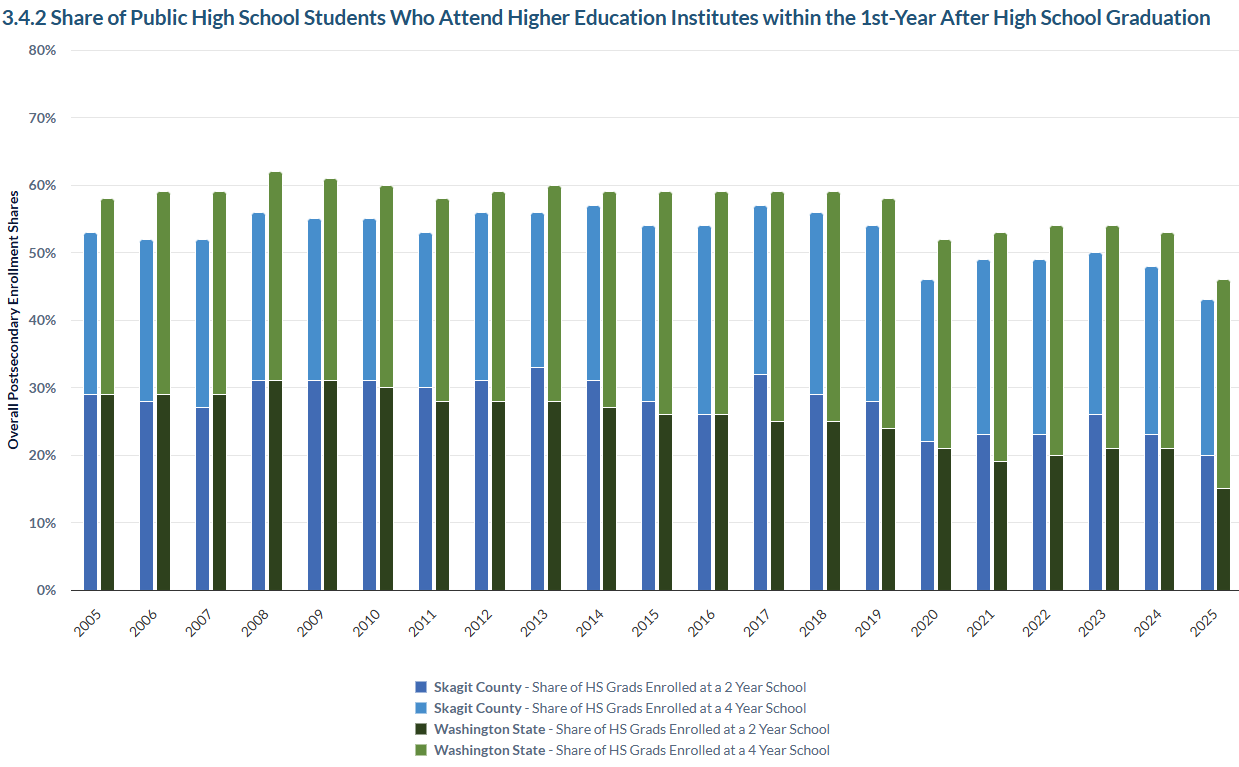
One’s formal education or training does not stop at high school. For today’s labor market, additional time is needed in a classroom or apprenticeship to land jobs or the path to these jobs that will offer a livable wage. This indicator tracks the share of graduating high school seniors who are enrolled in either a two- or four-year, non-profit educational institution within one year of graduation. The school can be anywhere in the country. Entrance into the trades, however, is not tracked.
The pandemic ushered in a significant decline in the share of seniors pursuing higher education and the class of 2025 is following the trend of the preceding classes since 2020. A total of 43% of county public school graduates were enrolled, representing the lowest percentage to date. In 2019, the same measure yielded 57%. The overall share in the county has been consistently lower than the state average. Most of the recent decline is due to the fraction of graduating seniors enrolled in a four-year institution.
In HEALTH: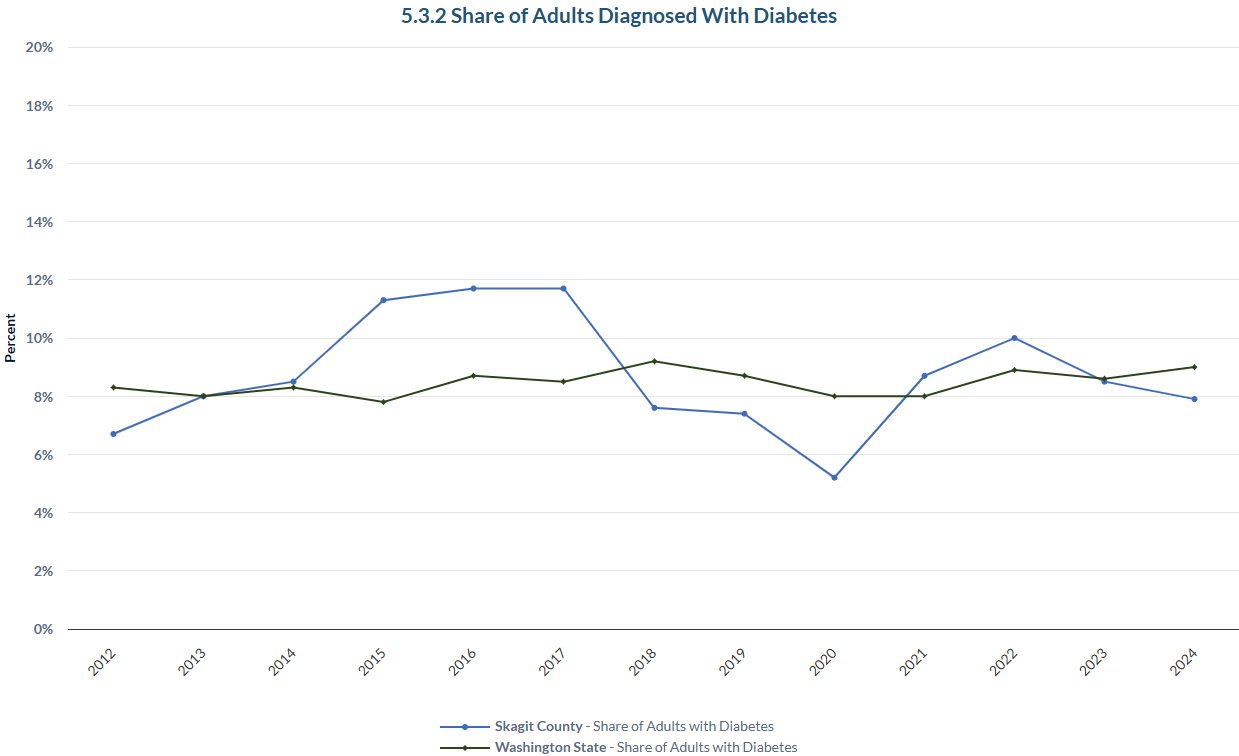 Share of the adult population who have been told they have diabetes has recently declined.
Diabetes, whether a Type I (adolescent onset) or Type II (adult onset) carries significant health challenges, often leading to shorter lifespans. This measure, from the Centers for Disease Control, addressed Type II of the disease.
For the most recent year with available data, 2024, the share of the adult (18+) population who have been told to have diabetes was 7.9%. This was slightly below the state average of 9%, although higher than the county rate registered in the period 2018-2020. The trend from 2012 has been modestly increasing.
In HOUSING: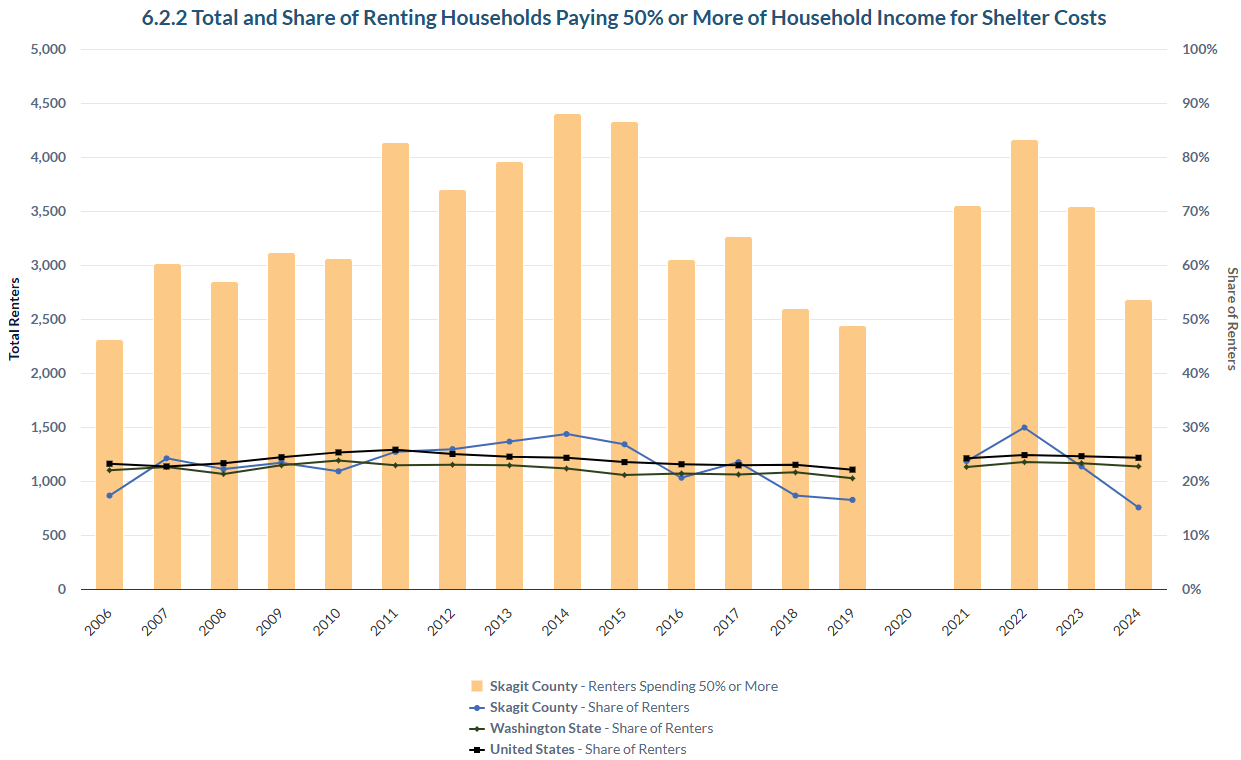
According to a long-standing rule by the U.S. Department of Housing & Urban Development, a household shouldn’t pay more than 30% of its income toward shelter costs, whether they are owner-occupants or renters. A share greater than 30% characterizes a household as “housing burdened.” A share greater than 50% of income puts that household in the category of “extremely housing burdened.” This measure, based on Census estimates, tracks the share of the latter for renters.
The good news: the share in Skagit County has been subsiding since reaching a peak in 2022. In 2024, the number of renting households facing this challenge numbered 2,675. That translated into a share of all renting households of 15%. This is the lowest share on record and now considerably lower than the rates characterizing the U.S. and Washington state. 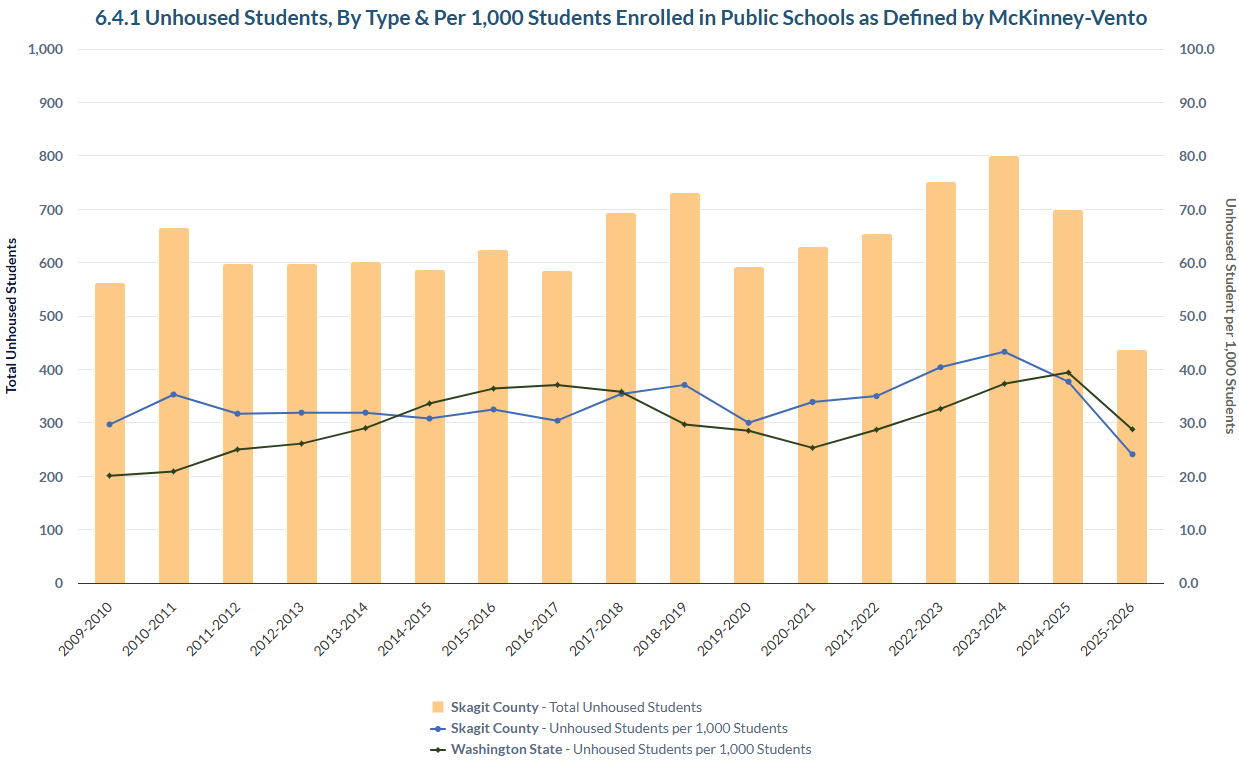
Homeless student count has recently plunged.
Homelessness takes many forms. The form likely in the popular thought is the unsheltered, that is, those living on the street. But one can be homeless while sheltered. The method many people associate with estimating homelessness is the one-day count, usually taken in January. This measure is different, in that it is based on assessments taken by public school districts, usually at the start of the school year. The students are typically not unsheltered, but do not have a permanent roof under which they regularly sleep. It is known as the McKinney-Vento count, based on the congressmen who shepherded passage of a federal aid bill to such students.
For school year 2025-2026, the records from county public schools reveal the lowest number of K-12 students on record, 438. This translates into the lowest rate of all enrolled students on record, at 2.4%. This year represents a remarkable turn-around from the peak reached in school year 2023-2024, when the rate stood at 4.3%. The recent results put the homeless student rate in the county below the state average.
updated 7.21.26
The full list of Skagit County Trends can be found here.